Your guide to our marketing reports
Understand terminology, what to look for and how to measure success.
Your Digital Marketing Report
How To Understand It
This is your resource to understanding the various reports you may have for digital marketing services. This guide will help you understand terminology, what to look for in the reports and how to measure success.
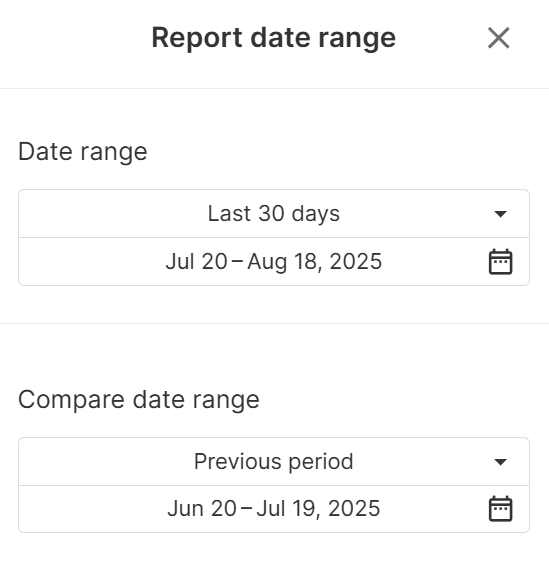
Selecting Date Ranges
Make sure the date range is set to the time range you wish to look at. You can edit this in the top right corner and choose any date range you like. You can also compare 2 different date ranges using the comparison options.
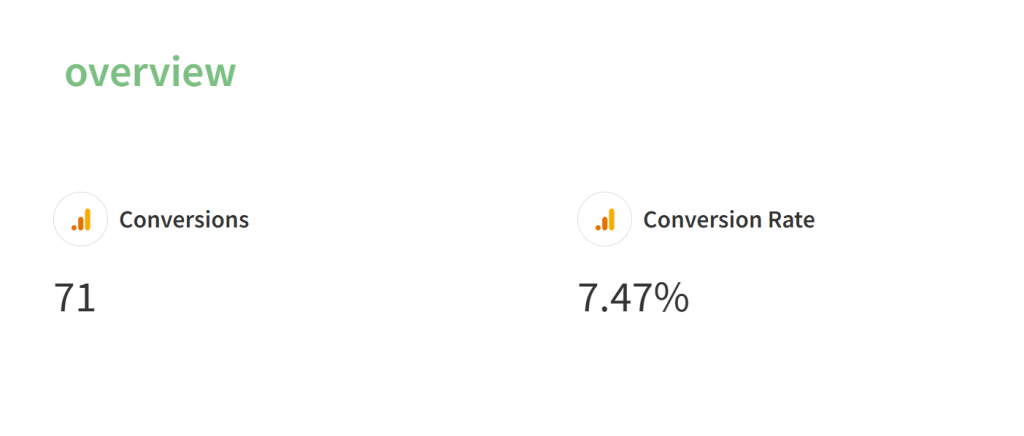
website overview (ga4) report
conversions
This is the number of enquiries the website has generated through all sources. This can range from phone calls and emails to bookings and job applications – any success metric relevant to your business is tracked here.
Conversion Rate
This shows what percentage of people have taken a conversion action / made an enquiry. A good conversion rate is typically 10%, but this depends on the type of business or thing being sold.
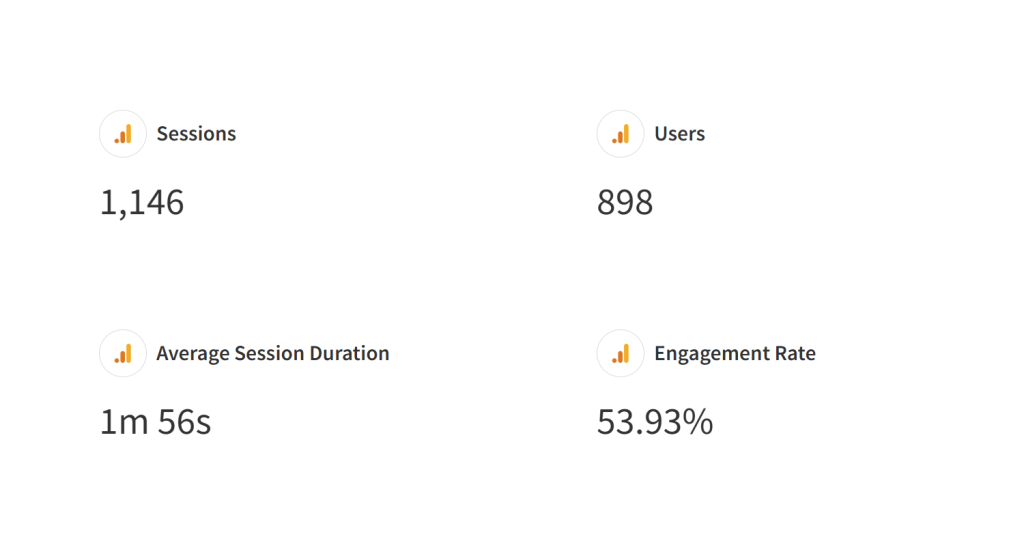
Sessions
This is the number of visits that your website has received in the time you’ve chosen.
Sessions vs Users
Sessions are the total number of times your website was viewed, and users are the total number of people who viewed your website. The number of users is usually fewer than the number of sessions because people often view your website more than once.
Session Duration
This is the average amount of time each user spent on your website in the time period. Most users only spend a few seconds on a website, so an average duration of over 1 minute is a good sign that your page is relevant and engaging.
Engagement Rate
This shows what percentage of people have interacted with your website in any way, from clicking on anything on the page to submitting forms. An engaging website will have an engagement rate of over 50%.
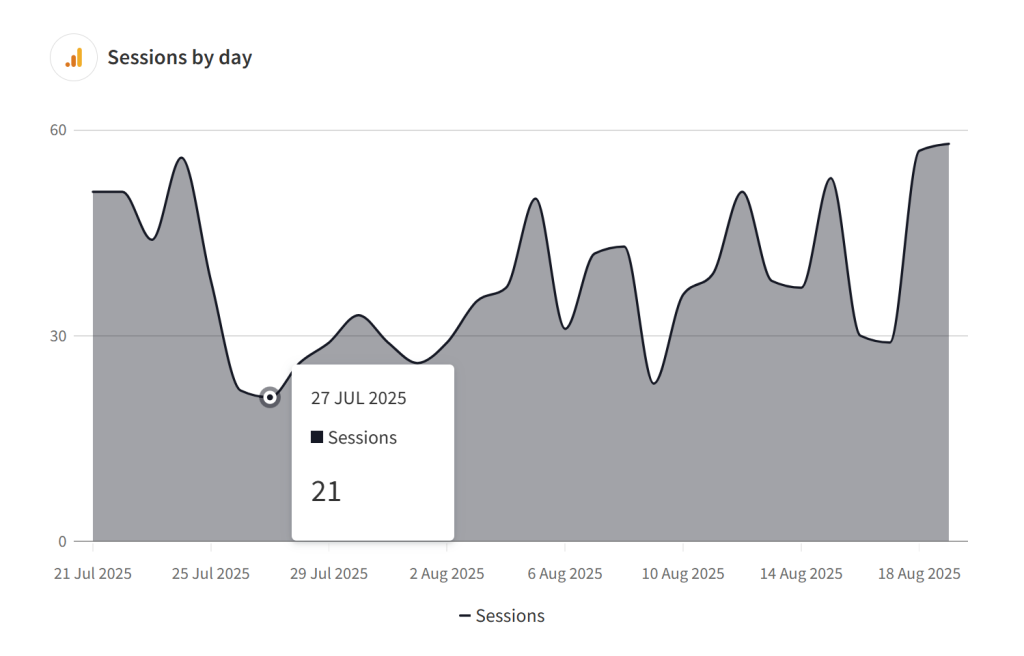
Sessions By Day
This shows how the number of sessions changes from day to day. It’s usual for a website to experience peaks and troughs in traffic over the course of a month, so this should give you an idea of when your busiest days in terms of traffic are. You can interact with this graph to see the number of sessions on a particular day.
Conversions by Day
Below the sessions by day report is the conversions by day report. It will show data from the same date range as the by day report, but plots the number of conversions that analytics has recorded from all sources instead. A note on conversion tracking: Google Analytics now requires users to accept cookies before their activity can be tracked. This can result in a portion of traffic not being reported; around 40% in some cases.
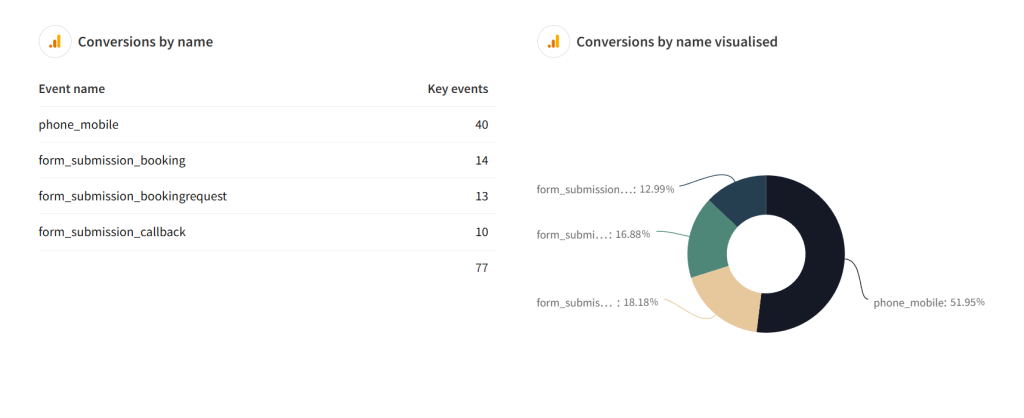
conversions By name
This shows how many of each conversion has been tracked by the website. In analytics, these are referred to as ‘key events’. In this example, 4 different conversion actions are being reported, including phone calls and lead form submissions. The graph on the right shows the percentage of total leads each action accounts for. As mentioned before, the number of leads may not be completely accurate as users must give consent to having their data recorded by accepting cookies.
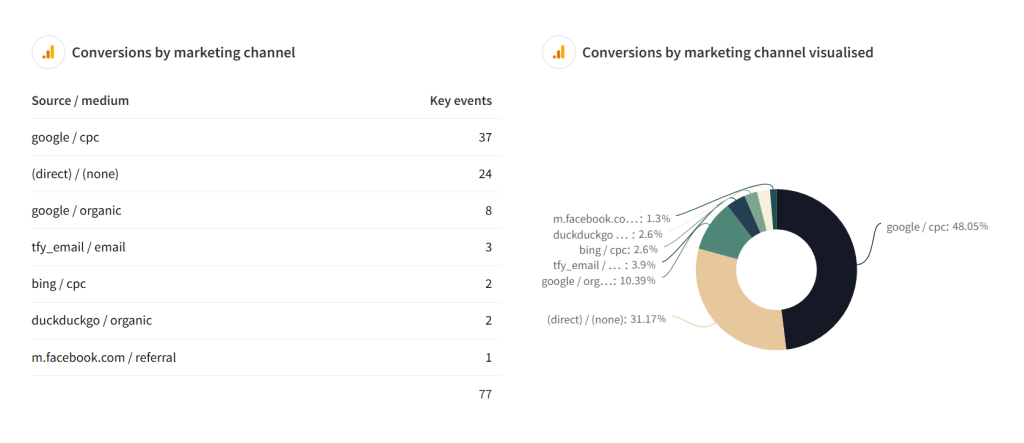
conversions By marketing Channel
This gives you a breakdown of where traffic is coming from. To explain what the main sources of leads are likely to be:
- Anything tagged with / cpc shows paid advertising referrals but only on search engines Google or Bing ads.
- Anything tagged with / paid shows leads acquired through any other online advertising such as Facebook ads
- (direct) / (none) shows leads that have come to your website directly and have not gone through any other source like search engines or social media. If you advertise using leaflets, this is a likely source for this kind of traffic.
- Anything tagged with / organic shows leads from search engines that have not been paid for.
- The / email tag shows leads signed up through email marketing.
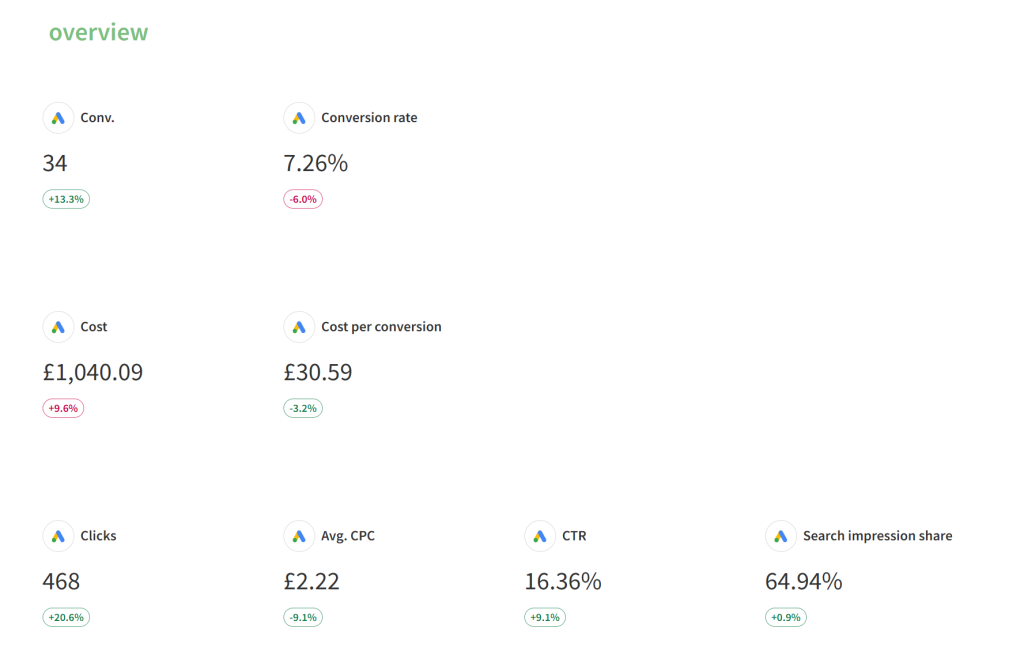
Google Ads Performance Report
Conversions (conv.)
This is the number of inquiries that your business has received.
Conversion Rate
This shows what percentage of clicks convert into leads. A great conversion rate is 10%.
Cost
This is how much the ads have spent.
Cost Per Conversion
How much has been spent on each conversion.
Clicks
How many clicks the ads have received.
Average CPC
CPC (Cost Per Click): How much each click has cost, on average.
CTR
CTR (Click-Through Rate): The percentage of people who clicked on the ad once shown it. A good click-through rate is 10%.
search Impression Share
This shows how visible your ads are. The impression share shows what percentage of all searches your ads appeared. Due to the way that advertising on Google works, it isn’t possible to show on 100% of searches. A good search impression share is over 70%.
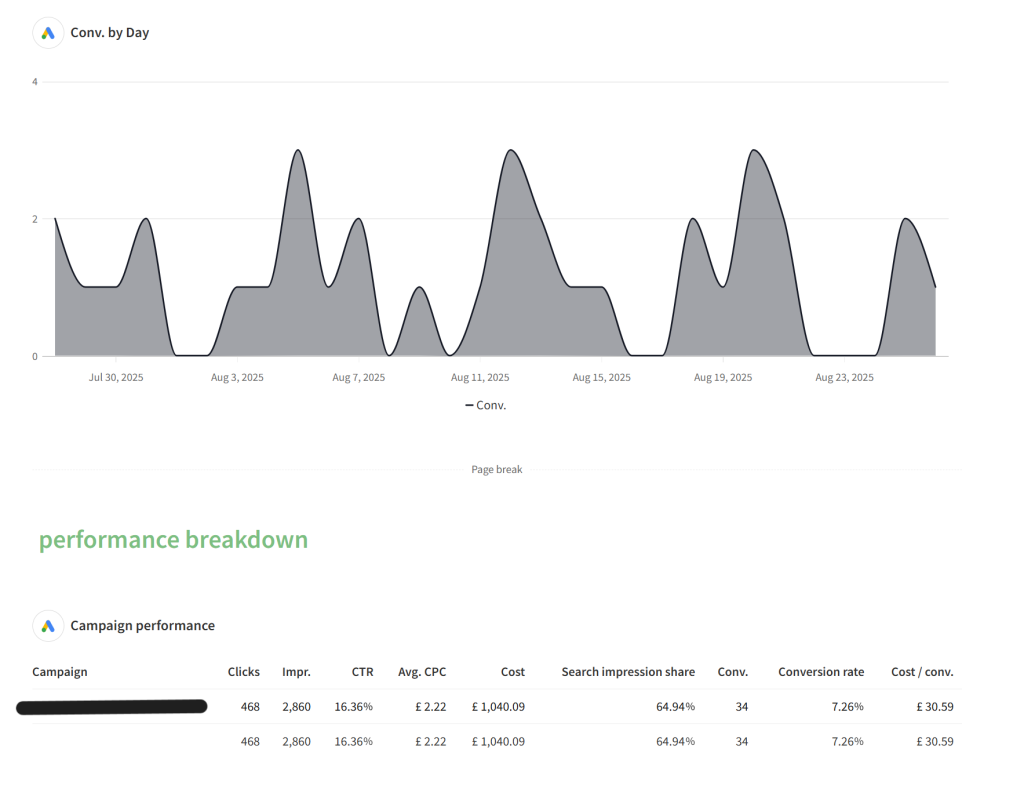
Conversions By Day
This shows when conversions come in by day over the selected time period.
Campaign Performance
This is a table containing a breakdown of campaign performance. If there are multiple campaigns running, you can quickly compare the performance of each and see which campaigns are working well.
ad group Performance
Each campaign contains different ad groups. We use these to sort and categorise the kinds of keywords that we run for different campaigns. For example, for service-based businesses running ads for local areas, keywords will be grouped by area or town name to make the data easier to understand.
keyword Performance
This is an overview of the performance of every keyword in the account. You can interact with the table to sort by most clicks, best conversion rate, or lowest cost per conversion to see what the best-performing terms are.
Facebook (Meta) ads Report
Reach
This shows the total number of people the ads reached in the selected time period.
Clicks
How many times your ads were clicked on.
CPC
How much it costs for each click. Calculated by dividing the ad spend by the number of clicks. A great CPC is under £1.
CTR
What percentage of people who saw the ad clicked on it. A great CTR is over 1%.
Reach and clicks by day
This shows the trends in the reach (number of people your ads reach) and clicks (how many times your ads were interacted with).

Performance overview
These show performance breakdowns by ad group and ad creative. Useful if running different ad sets for different demographics or locations, or testing different ad creatives.
campaign Performance
This shows ad performance for the campaigns as a whole. Different campaigns will be aiming to achieve different marketing objectives or specific promotions and are used as a way of delineating different marketing efforts.
ad set Performance
Each campaign can be broken down further into ad groups. A common use is to divide audiences up into easier to manage groups or to run different budgets or ad schedules.
advert Performance
This shows the performance of each ad creative in use during the time period selected.

seo report
conversions and Conversion Rate
Like the GA4 and Google Ads report, this is a measure of the number of business enquiries tracked by your website, as well as the rate that they happen.
sessions
Broadly, this is the number of total visits your website has had. A session is how Analytics tracks the activity of users. Sessions expire a while after a user leaves the site, but if the same user returns before the session expires, their activity won’t be tracked twice. For example, if a user loads your page 5 times in an hour, this will only track as a single session. The purpose of tracking this way is to provide a more accurate measurement of your performance.
new users
This is the number of users who have not logged a session on your website yet.

visibility
The visibility statistic is calculated based on every keyword relevant to your business and shows a score of how often your website appears in the top results.
average position
This shows the average slot on search results that your business appears on. An average position below 10 means that your page consistently appears on the first page of search results, and the closer the score is to 1 means the higher is appears on the first page.
For example, an average position of 12 means that your page shows on the second page and in the second position.
overall performance
This shows on how many keywords you appear in the top 5, top 10, and top 30.

microsoft (bing) ads report
amount Spent
How much your ads have spent in the selected time period.
Clicks
How many clicks your ads have received.
average cpc
Similar to Google Ads, this shows how expensive each click was, on average.
ctr
What percentage of people who saw the ad clicked on it. A great CTR is over 1%.
impression share percent
This shows how visible your ads are. The impression share shows what percentage of all searches your ads appeared.